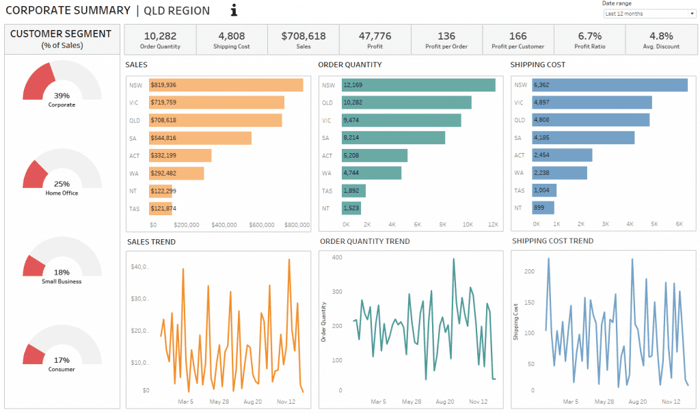
What is data visualisation?
If you've ever looked at a spreadsheet full of data, you're probably familiar with that overwhelming feeling of information overload. How do you organise and present all the data your company (or your team) generates in a way that others can easily understand - and that helps you gain the most relevant insights for strategy and decision-making?
Visualisation is the most efficient and effective way to convert the data from various sources and channels into understandable, visually appealing and useful information to improve business strategy.


The benefits of data visualisation
Humans are highly visually driven, and we can interpret a lot of information by seeing arrays of colors, shapes and patterns presented in the right context. This makes it easy for us to spot repeating trends, insights and excesses that help us make strategic business choices.
How does data visualisation work?
If you're looking to start using data visualisation to improve reporting and business operations, there are a number of different ways to get started, depending on the data sources you want to analyse, your data analytics expertise, and how much customisation is required.
The experts at Full Orbit can help you with this, by jointly unlocking the various data sources and implementing data visualisations that are fully tailored to the user needs within your organisation.
Our services
In the business monitoring phase we support customers with our expertise in unlocking, processing, analysing and visualising data from various sources and processes.
KPI Dashboard
Process Mining
Feel free to contact us
Ask Eric